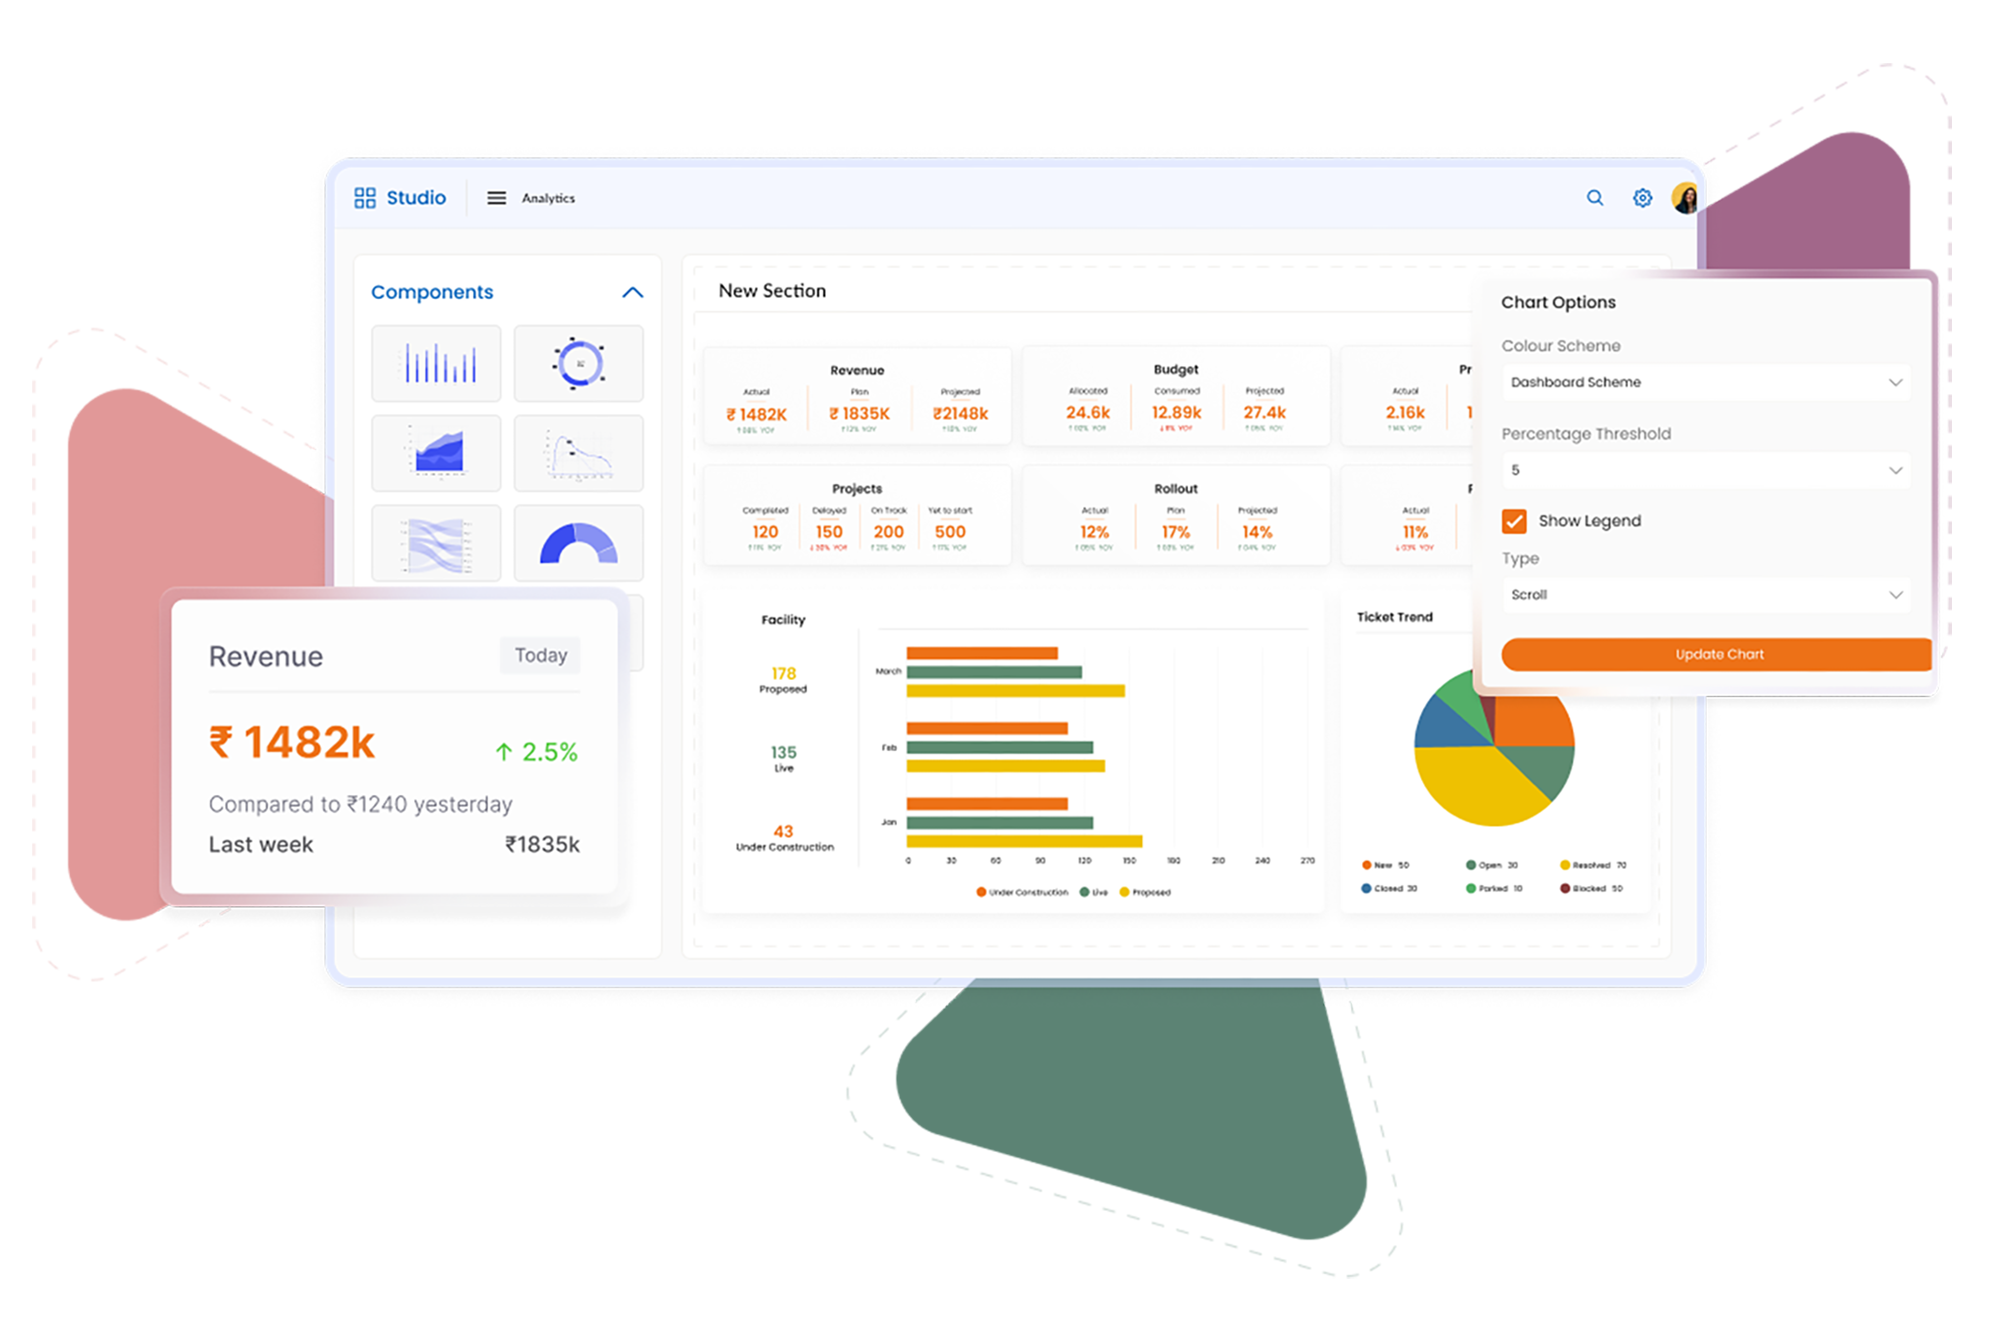
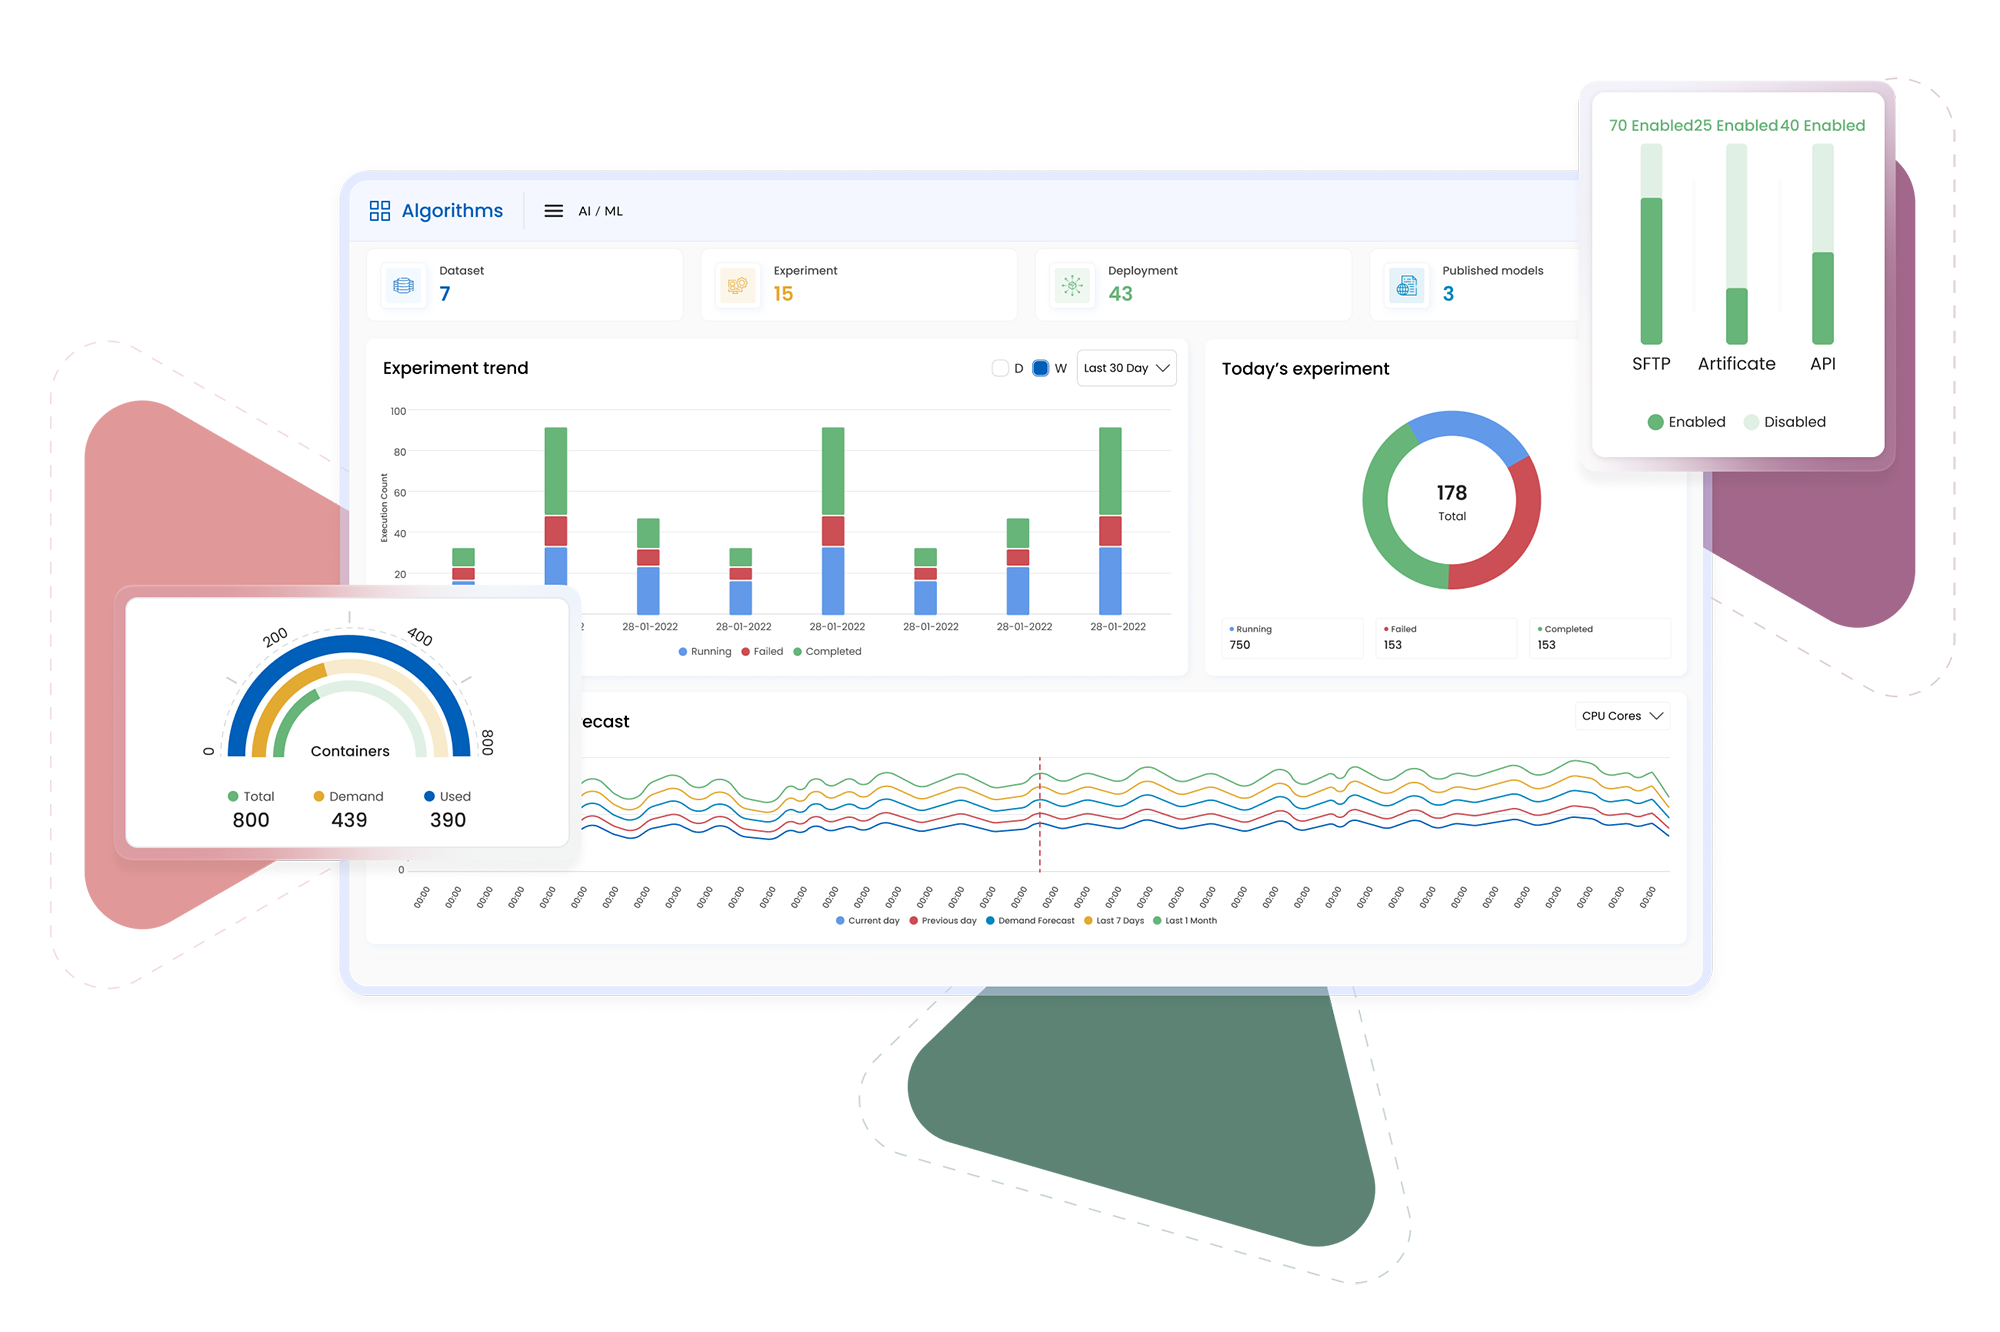
QuickCraft's Analytics Designer empowers you to extract actionable insights from your data effortlessly. Define datasets, measures, and dimensions to create customized reports that track key metrics aligned with your business goals. Visualize data trends and patterns using a variety of chart types such as pie, bar, column, donut, bubble and more. Customize chart properties and design dynamic dashboards with a simple drag-and-drop interface. Share insights with others through email in pdf or image formats. Make informed decisions backed by powerful analytics.
Key features
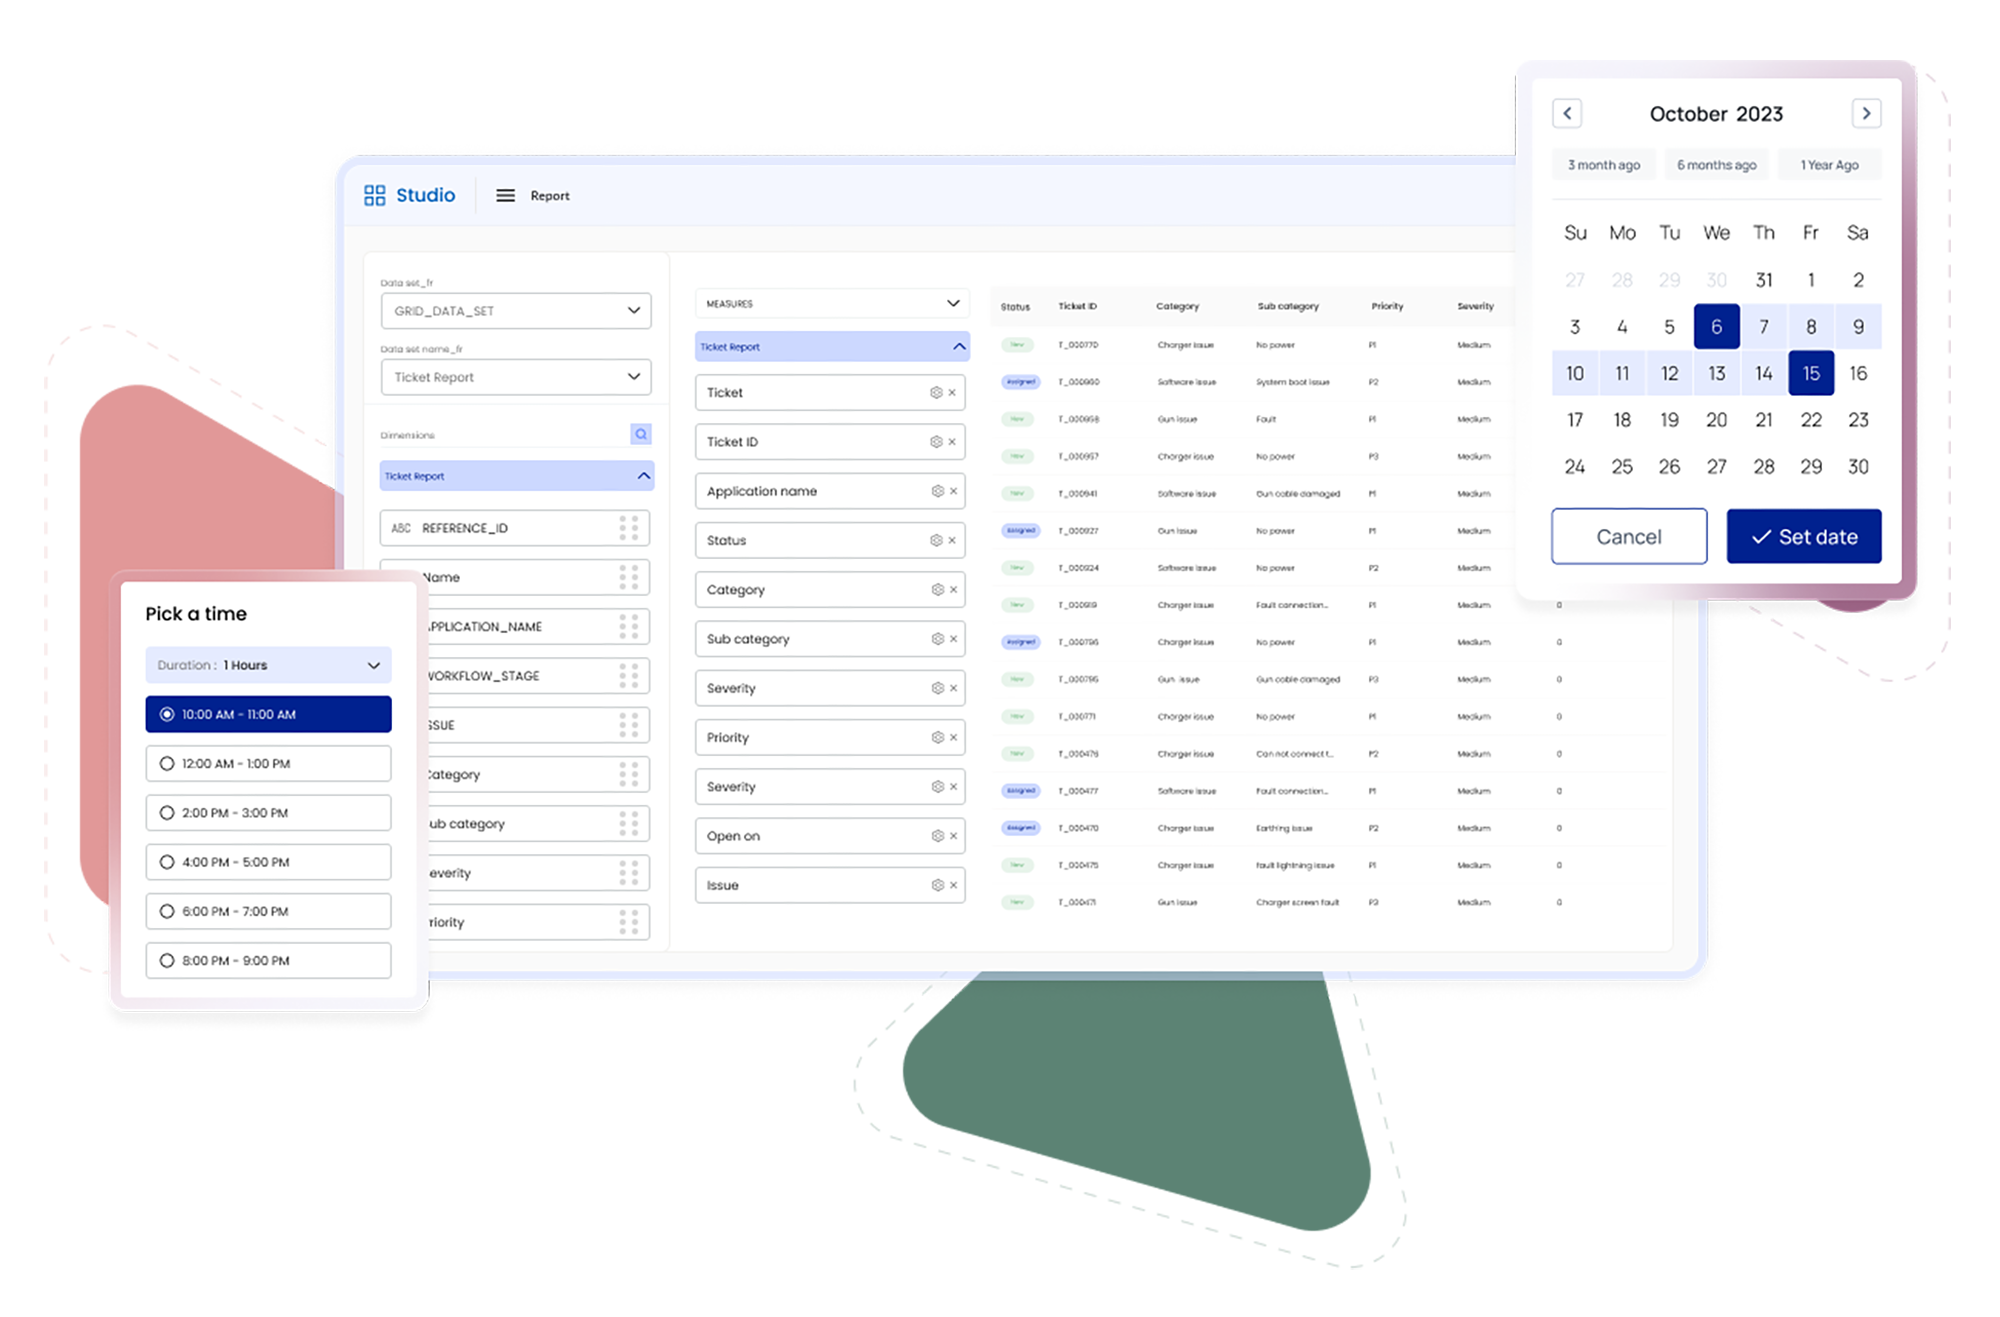
Define Datasets, Measures, and Dimensions
Create visual charts and graphs
Support for various chart types (Pie, Bar, Column, Donut etc.)
Customizable chart filters and properties
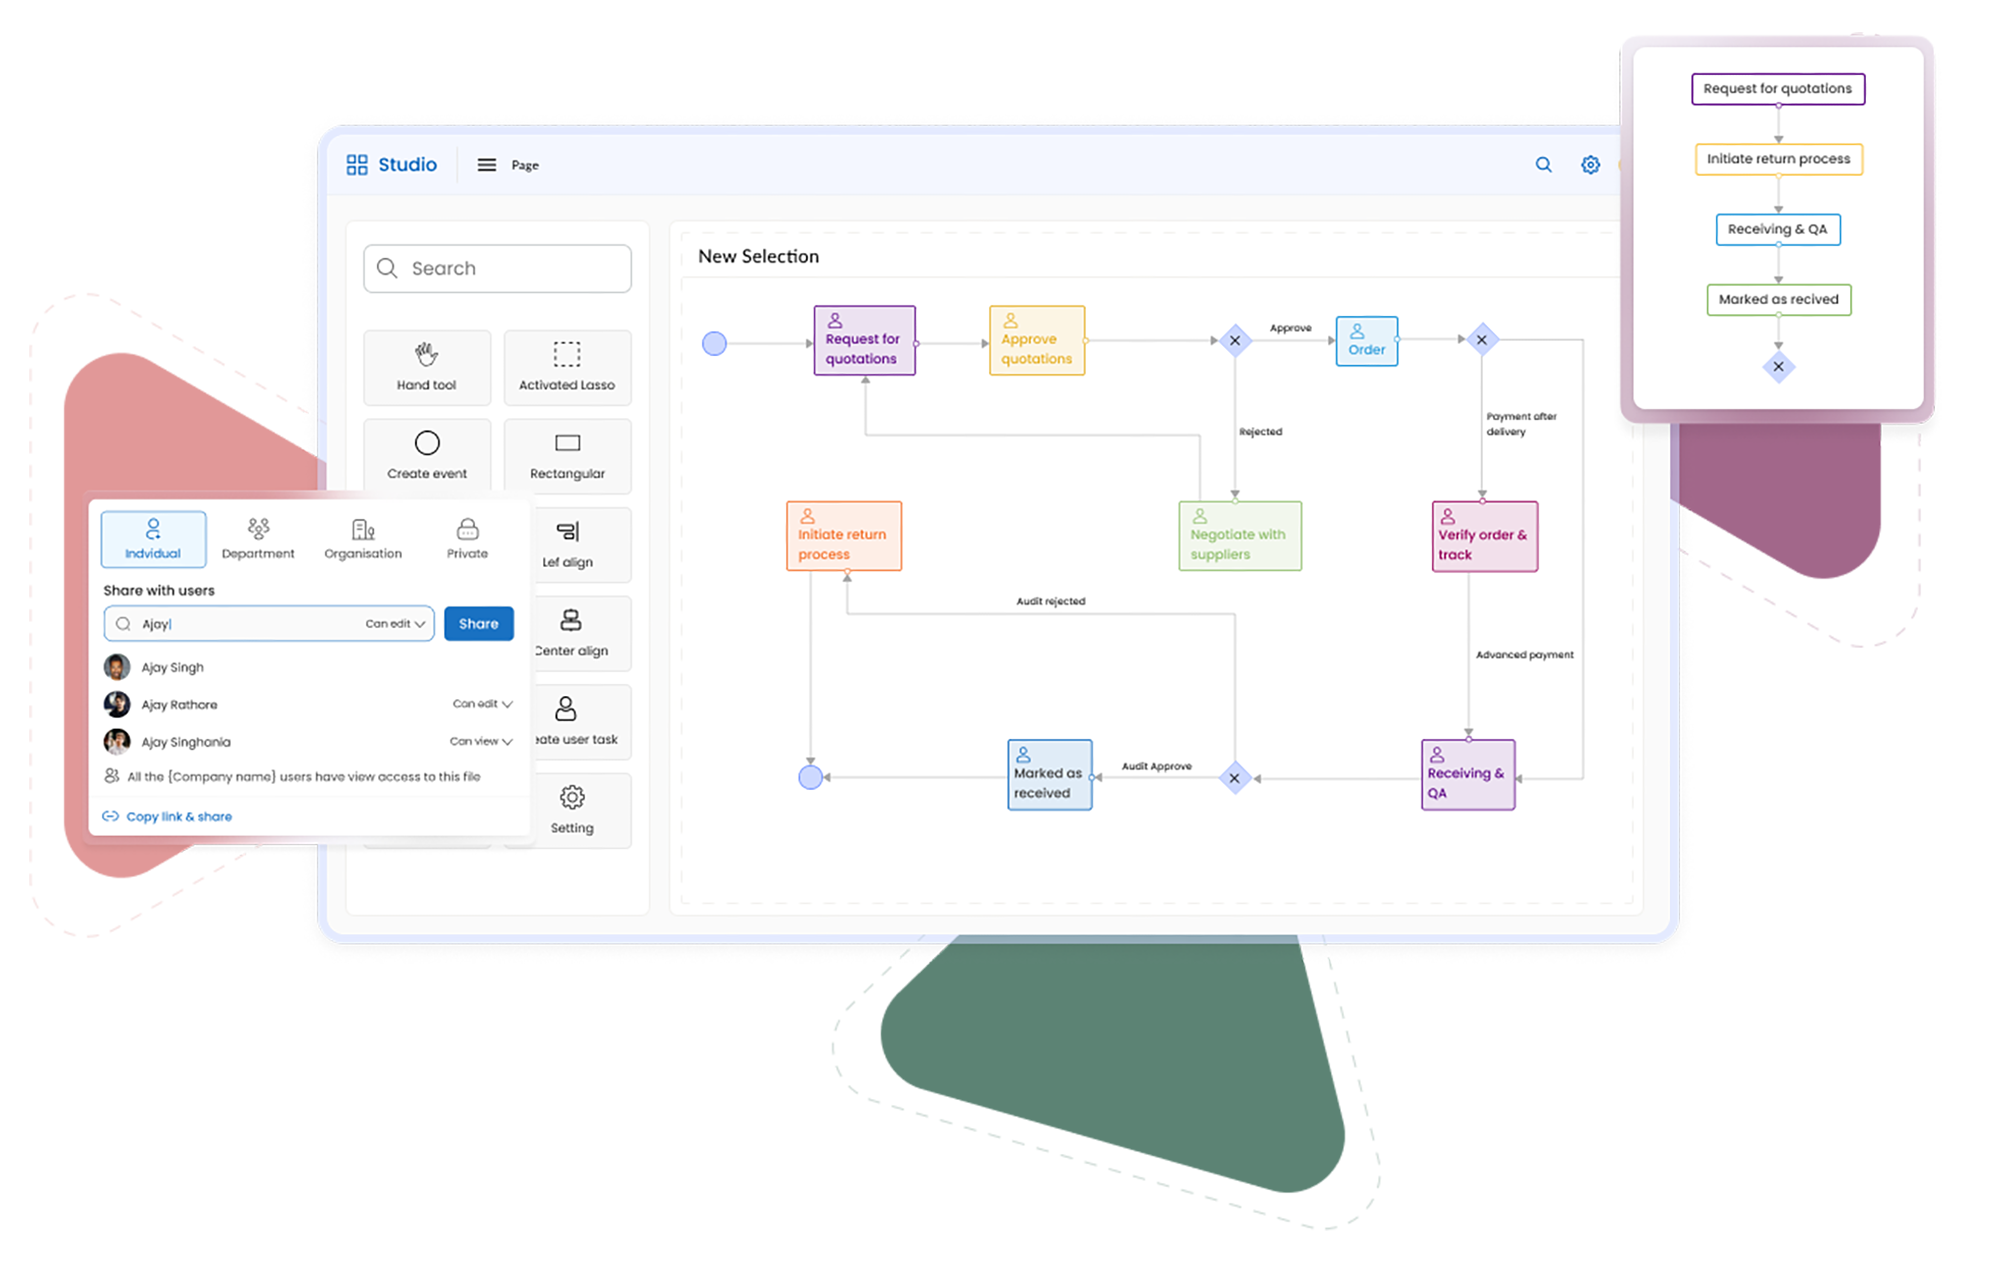
Design dynamic dashboards with drag-and-drop
Share insights through Email in PDF or image formats